OpenCV中的快速直线检测
cv::ximgproc::FastLineDetectors是opencv-contrib中用于检测直线的模块,该方法能在较短时间内获得精度较高的直线检测结果,且不需要调节参数。该函数是LineSegmentDetector因版权问题从OpenCV中移除后最易用的直线检测小能手,没有之一。本文介绍该功能的使用方法其输出结果剖析。
本文范例运行环境
- python3.6
- opencv-contrib-python 4.4.0.44
FastLineDetectors运行必要条件
FastLineDetectors属于opencv-contrib中的模块,需要安装opencv-contrib-python。在python的opencv相关的安装包中,opencv-python 包含主要模块,opencv-contrib-python 包含主要模块以及一些扩展模块。但这两个模块并不兼容,如果已经安装过opencv-python,需要先卸载,再安装opencv-contrib-python。
1 pip uninstall opencv-python
2 pip install opencv-contrib-python
在OpenCV 4.1.0之前的版本中,有一个LineSegmentDetector模块,功能强大,检测直线非常便捷,但该函数因为版权问题已在4.1.X版本上已移除,故此处不讨论此方案。LineSegmentDetector相关的问题可以参考:
-
any-implementation-of-linesegmentdetector-for-python
https://answers.opencv.org/question/215800/any-implementation-of-linesegmentdetector-for-python/
-
LineSegmentDetector needs to be removed for license
FastLineDetectors应用示例
 1 import cv2
 2 import numpy as np
 3 img = cv2.imread('sudo.png')
 4 gray = cv2.cvtColor(img,cv2.COLOR_BGR2GRAY)
 5 #Create default Fast Line Detector (FSD)
 6 fld = cv2.ximgproc.createFastLineDetector()
 7 #Detect lines in the image
 8 lines = fld.detect(gray)
 9 #Draw detected lines in the image
10 drawn_img = fld.drawSegments(gray,lines)
11 cv2.imshow("FLD", drawn_img)
12 cv2.waitKey(0)
如以上代码所示:
第1~2行导入python包。
第3行读入测试图片,本文中测试图片与代码文件在同一路径,故只有图片名称。更改测试图像时,更改该行代码中的图像名称即可。
第4行将测试图片转换为灰度图。
第6行创建FastLineDetectors检测实例,这里使用的是默认参数,其参数顺序及意义如下:
retval = cv.ximgproc.createFastLineDetector( [, _length_threshold[, _distance_threshold[, _canny_th1[, _canny_th2[, _canny_aperture_size[, _do_merge]]]]]] )
Parameters
_length_threshold 10 - Segment shorter than this will be discarded
_distance_threshold 1.41421356 - A point placed from a hypothesis line segment farther than this will be regarded as an outlier
_canny_th1 50 - First threshold for hysteresis procedure in Canny()
_canny_th2 50 - Second threshold for hysteresis procedure in Canny()
_canny_aperture_size 3 - Aperturesize for the sobel operator in Canny()
_do_merge false - If true, incremental merging of segments will be perfomred
第8行使用FastLineDetectors检测测试图像中的直线。
第10行根据检测结果绘制直线。
第11~12行用于显示检测结果。
如下动图所示,我选取了两张图,均使用默认参数来检测,图中的直线基本被检出,说明该函数的通用性还是比较强的。
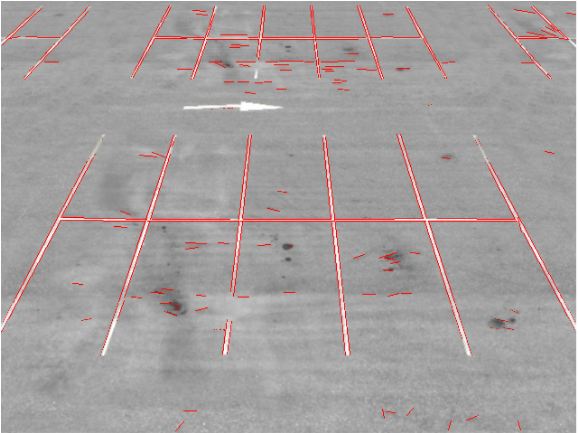
以其中停车场的图片为例,图中有许多小短线,此时可以更改createFastLineDetector的默认参数,设置直线的长度来对检测直线进行过滤。
FastLineDetectors检测结果详解
通常我们检测直线并不只是为了将其绘制出来而已,我们可能需要知道该直线与其他直线的关系。这时我们就需要能取用检测得到直线两个端点的坐标。
接下来开始解析FastLineDetectors的检测结果,学习如何取用检测直线的端点坐标。
在"FastLineDetectors应用示例"小节中,在完成直线检测代码之后,添加如下代码,先观察一下FastLineDetectors检测结果的各种属性:
print("数据类型",type(lines)) #打印数组数据类型
print("数组元素数据类型:",lines.dtype) #打印数组元素数据类型
print("数组元素总数:",lines.size) #打印数组尺寸,即数组元素总数
print("数组形状:",lines.shape) #打印数组形状
print("数组的维度数目",lines.ndim) #打印数组的维度数目
运行后,可以看到FastLineDetectors的检测结果的各种输入为:
数据类型 <class 'numpy.ndarray'>
数组元素数据类型: float32
数组元素总数: 724
数组形状: (181, 1, 4)
数组的维度数目 3
然后我们到github查看一下drawSegments的实现函数,如下所示:
 1 void FastLineDetectorImpl::drawSegments(InputOutputArray _image, InputArray lines, bool draw_arrow)
 2 {
 3   CV_INSTRUMENT_REGION();
 4
 5   CV_Assert(!_image.empty() && (_image.channels() == 1 || _image.channels() == 3));
 6
 7    Mat gray;
 8    if (_image.channels() == 1)
 9    {
10        gray = _image.getMatRef();
11   }
12    else if (_image.channels() == 3)
13    {
14       cvtColor(_image, gray, COLOR_BGR2GRAY);
15    }
16
17   // Create a 3 channel image in order to draw colored lines
18    std::vector<Mat> planes;
19    planes.push_back(gray);
20    planes.push_back(gray);
21    planes.push_back(gray);
22
23    merge(planes, _image);
24
25    double gap = 10.0;
26    double arrow_angle = 30.0;
27
28    Mat _lines;
29    _lines = lines.getMat();
30    int N = _lines.checkVector(4);
31    // Draw segments
32    for(int i = 0; i < N; ++i)
33    {
34        const Vec4f& v = _lines.at<Vec4f>(i);
35        Point2f b(v[0], v[1]);
36        Point2f e(v[2], v[3]);
37        line(_image.getMatRef(), b, e, Scalar(0, 0, 255), 1);
38        if(draw_arrow)
39        {
40            SEGMENT seg;
41            seg.x1 = b.x;
42            seg.y1 = b.y;
43            seg.x2 = e.x;
44            seg.y2 = e.y;
45            getAngle(seg);
46            double ang = (double)seg.angle;
47            Point2i p1;
48            p1.x = cvRound(seg.x2 - gap*cos(arrow_angle * CV_PI / 180.0 + ang));
49            p1.y = cvRound(seg.y2 - gap*sin(arrow_angle * CV_PI / 180.0 + ang));
50            pointInboardTest(_image.getMatRef(), p1);
51            line(_image.getMatRef(), Point(cvRound(seg.x2), cvRound(seg.y2)), p1, Scalar(0,0,255), 1);
52        }
53    }
54}
上述代码中:
第28~37行用于绘制检测到的直线,其中lines[i][0]~lines[i][3]中存储的四个元素分别为第i条直线端点1的X,Y坐标和端点2的X,Y坐标。
第38行中的变量[draw_arrow],是函数drawSegments的参数之一,默认值为false,用于设定是否在检测直线的其中一个端点处绘制箭头。
根据以上信息,我们推测在python的FastLineDetectors检测结果中,lines[i][0][0]~lines[i][0][3]分别对应第 i 条直线端点1的X,Y坐标和端点2的X,Y坐标。
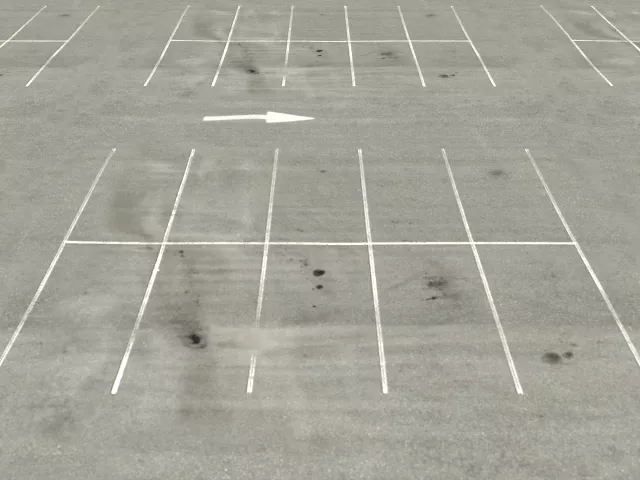
为了证明上述推测,我们选取下图作为测试图片,修改一下相关代码,实现如下功能:找出检测结果中最长的一根直线,绘制该直线及其两个端点,并且在该直线一个端点处绘制箭头。
 1 import cv2
 2 import numpy as np
 3 from scipy.spatial import distance as dist
 4
 5 img = cv2.imread('sDQLM.png')
 6 gray = cv2.cvtColor(img,cv2.COLOR_BGR2GRAY)
 7
 8 #Create default Fast Line Detector (FSD)
 9 fld = cv2.ximgproc.createFastLineDetector()
10
11 #Detect lines in the image
12 lines = fld.detect(gray)
13
14 dMax = 0
15 bx_Max = 0
16 by_Max = 0
17 ex_Max = 0
18 ey_Max = 0
19
20 for L in lines:
21
22    bx,by,ex,ey = L[0]
23
24    # compute the Euclidean distance between the two points,
25    D = dist.euclidean((bx, by), (ex, ey))
26
27    if D > dMax:
28        dMax = D
29        bx_Max = bx
30        by_Max = by
31        ex_Max = ex
32        ey_Max = ey
33
34 lineMax = np.array([[[bx_Max, by_Max, ex_Max,ey_Max]]])
35 #Draw detected lines in the image
36 drawn_img = fld.drawSegments(gray,lineMax,True)
37 cv2.circle(drawn_img, (bx_Max, by_Max), 1, (255,0,0), 2)#line begin
38 cv2.circle(drawn_img, (ex_Max, ey_Max), 1, (0,255,0), 2)#line end
39
40 cv2.imshow("FLD", drawn_img)
41 cv2.waitKey(0)
上述代码中:
第25行用于计算直线的长度,便于我们找出检测结果中最长的直线。
第34行用最长的直线的两个端点重新构建一个np.array。
第36行绘制最长的直线,并且第三个参数设置为TRUE,即在直线其中一端绘制箭头。
第37~38行,在图中绘制两个端点。
运行结果如下:
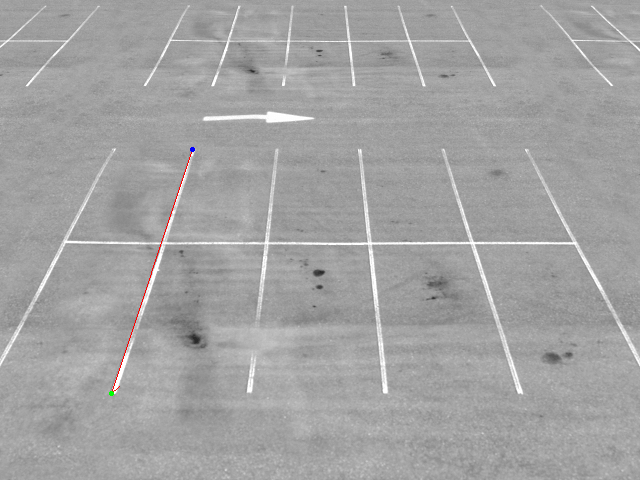
FastLineDetectors可以方便的检测图中的直线,并且可以简单的取用直线两个端点的坐标,接下来就可以用它实现更多有趣的功能。
本文到此结束,感谢阅读。
原文链接:https://livezingy.com/fastlinedetectors-opencv-contrib/