- New: 为监控大盘增加多种类型的图表支持,这是该版本最大的Feature
- New: 业务组可以配置是否作为标签附加到时序数据上,这是第二大Feature
- New: 支持OIDC登录,这是第三大Feature
- New: 增加一些常用的告警规则在
etc/alerts,可以直接导入系统 - New: 增加一些常用的监控大盘在
etc/dashboards,可以直接导入系统 - New: 修改chart表的大小,改成text,不再使用varchar(8192)
- New: 增加一种新的go plugin的方式来处理告警发送
- New: 活跃告警和历史告警增加group_name字段,存放业务组的名字
- New: 支持导入内置告警规则和监控大盘,后端已完成,前端还没有
- New: 告警事件支持聚合视图查看,后端已完成,前端还没有
- Fix: 解决无法删除监控大盘的脏数据的问题
- Fix: 上报的监控数据不再截断小数点,有些场景小数点确实很长
- Fix: 修改机器归属的业务组,选择业务组的时候没有从后端拉取
更新内容:n9e二进制、如下sql、etc下的配置文件、pub目录(pub下的内容从 https://github.com/n9e/fe-v5/releases/tag/v5.1.7 单独下载)
CREATE TABLE `metric_view` (
`id` bigint unsigned not null auto_increment,
`name` varchar(191) not null default '',
`cate` tinyint(1) not null comment '0: preset 1: custom',
`configs` varchar(8192) not null default '',
`create_at` bigint not null default 0,
`create_by` bigint not null default 0 comment 'user id',
`update_at` bigint not null default 0,
PRIMARY KEY (`id`),
KEY (`create_by`)
) ENGINE=InnoDB DEFAULT CHARSET = utf8mb4;
CREATE TABLE `alert_aggr_view` (
`id` bigint unsigned not null auto_increment,
`name` varchar(191) not null default '',
`rule` varchar(2048) not null default '',
`cate` tinyint(1) not null comment '0: preset 1: custom',
`create_at` bigint not null default 0,
`create_by` bigint not null default 0 comment 'user id',
`update_at` bigint not null default 0,
PRIMARY KEY (`id`),
KEY (`create_by`)
) ENGINE=InnoDB DEFAULT CHARSET = utf8mb4;
insert into alert_aggr_view(name, rule, cate) values('GroupBy BusiGroup, Severity', 'field:group_name::field:severity', 0);
insert into alert_aggr_view(name, rule, cate) values('GroupBy Metric', 'tagkey:__name__', 0);
alter table alert_cur_event add column `group_name` varchar(255) not null default '' comment 'busi group name';
alter table alert_his_event add column `group_name` varchar(255) not null default '' comment 'busi group name';
alter table busi_group add column `label_enable` tinyint(1) not null default 0;
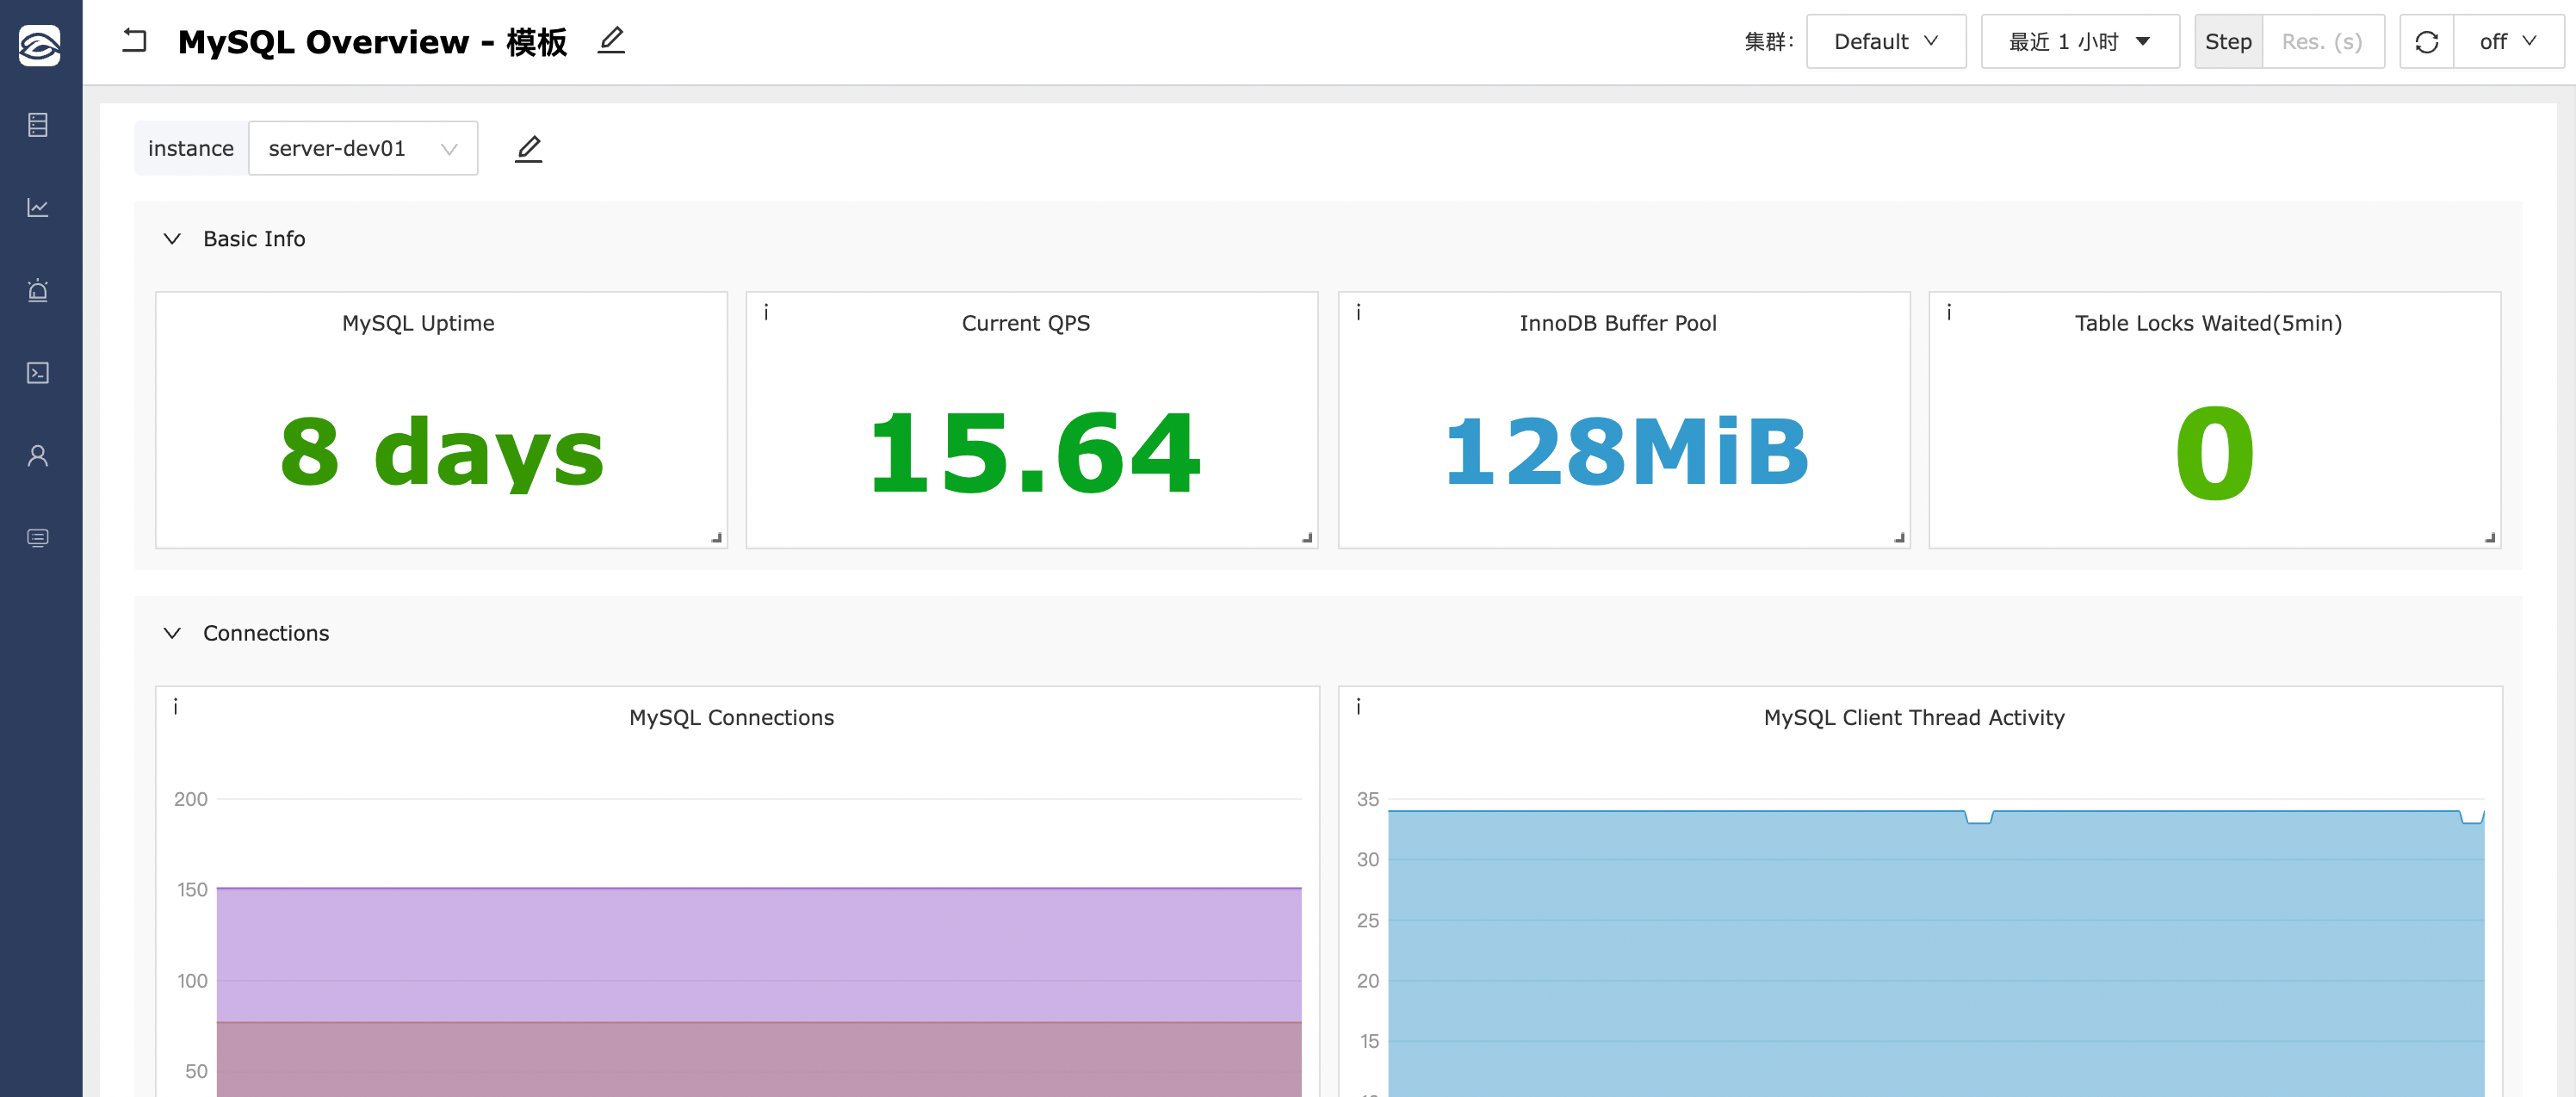
alter table busi_group add column `label_value` varchar(191) not null default '' comment 'if label_enable: label_value can not be blank';附:MySQL监控大盘
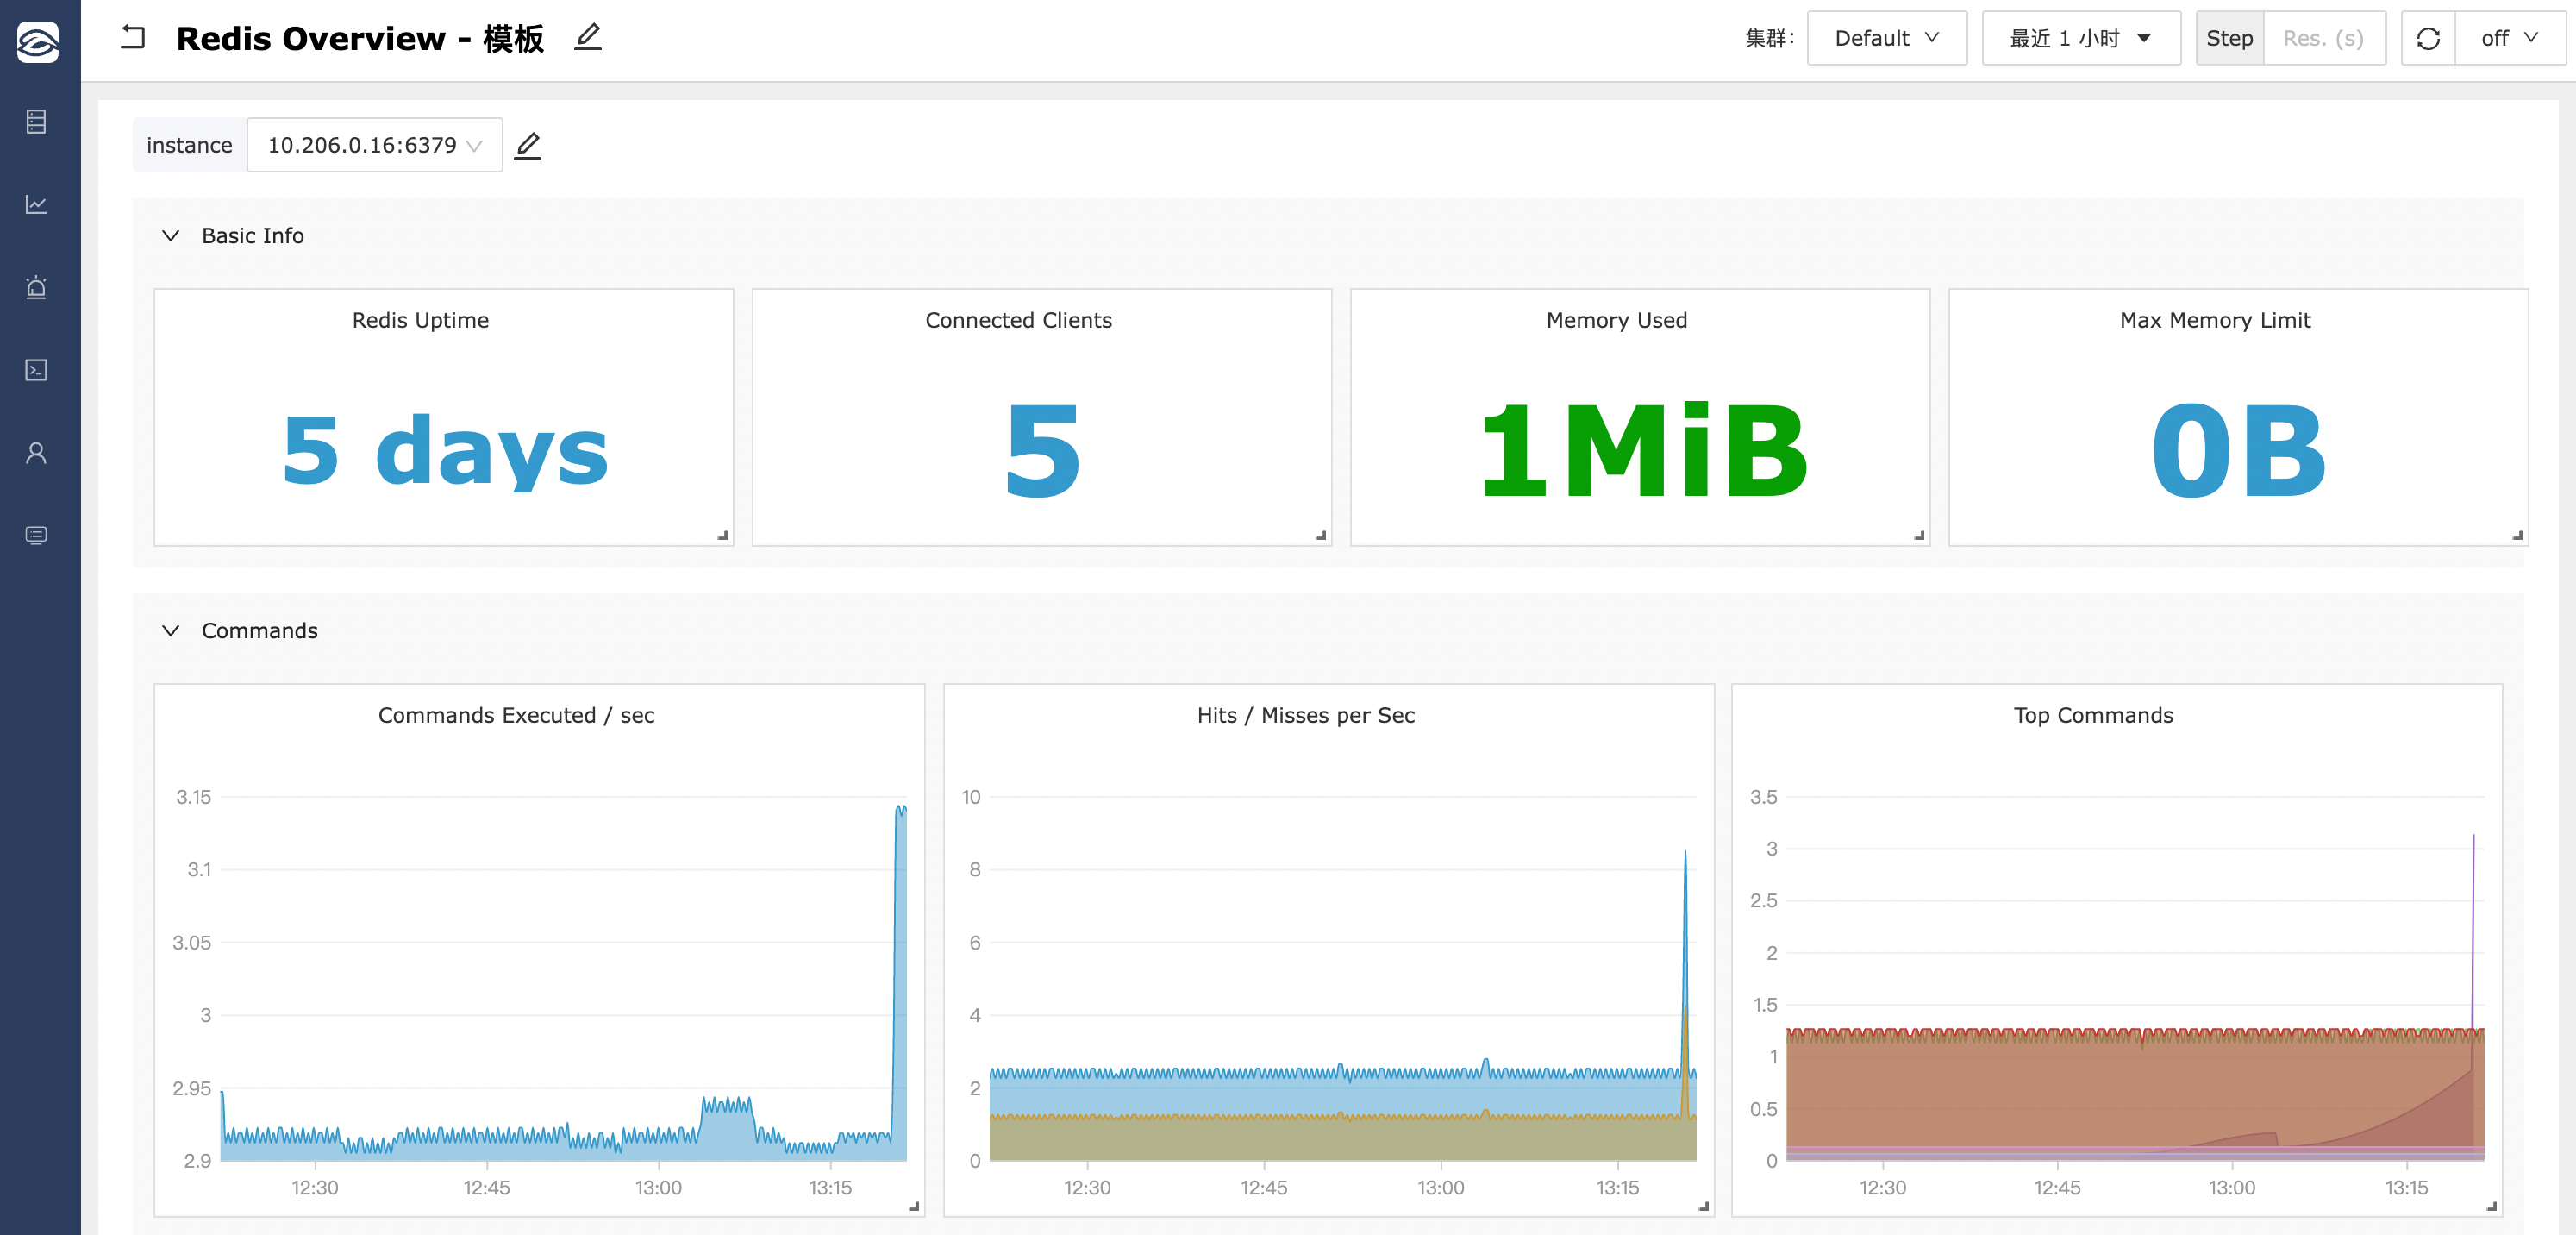
附:Redis监控大盘